
Targetting the 15-minute zones
As long as the 15 Min H Pressure is bearish, the 8hr zones could be hit tomorrow. This bounce was strong but unable to break the 15.


NVIDIA
I will open up the MIC at 10:00 AM if anyone is available to review price action in the past few days and potentials going forward.
Blue – pressure delivering to target
With potential break up.


ALL INDICES REVIEW:


Notice how effective the waves are as a supporting guide to the other set of tools in the trading system.

Review this image and post your comments on the general chat as to why this is happening. If you do not know that is fine, I will explain.

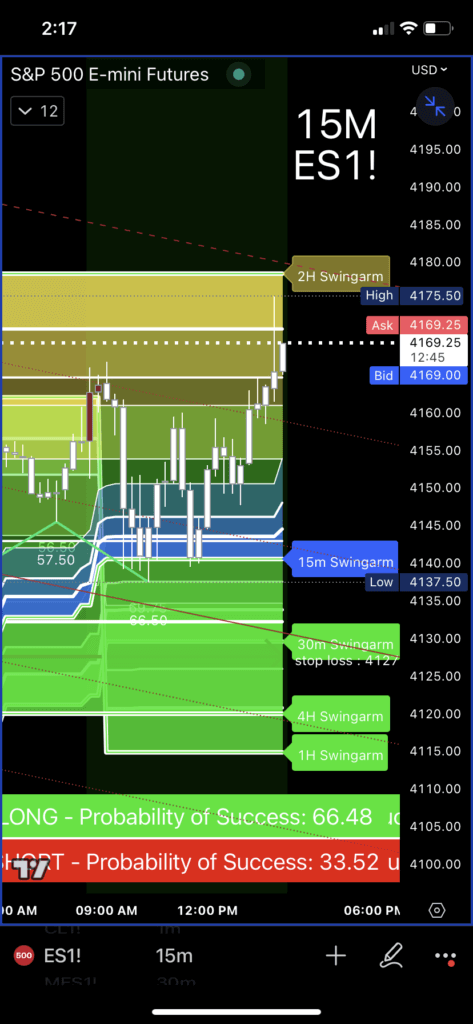
There are two 4 Hr SwingArms. One bullish and one bearish. Why??
Both are 28/5.
There’s a distinction between the two. The first is a standard 4-hour SwingArm, while the second is a 4-hour high-pressure SwingArm targeting the regular 4-hour zones above. Now, it’s clear to see where potential short zones and likely institutional selling areas are. The current two-hour interval? It’s internal, which is expected to be overridden by the combined force of the 8-hour and 4-hour high-pressure SwingArms. This is backed by the upward trend of the 15-minute bullish pressure that keeps extending upwards.
As the upward trend persists, the price action fluctuates from support to resistance and vice versa, creating a pattern of increasing lows and highs
The Nasdaq is enjoying a robust upward movement, as well as ES500; and Russell is bouncing back nicely from an ideal bullish buy zone. As it stands, all three indices are collectively making a strong push upwards. Keep an eye on this positive trend!


Just so you know, the 4-hour interval is also considered an internal and there’s a possibility it might eventually trend upwards too. It’s crucial to understand that the bounce originating from October 13th could potentially aim for the 4500 mark.
#NASDAQ #rty_f #StockMarket #DayTrading #ForexTrading #CryptoTrading #OptionsTrading #SwingTrading #TechnicalAnalysis #TRADINGTIPS


As you can see, RUT has more of a challenge and it can certainly pull the market down if it is unable to flip the cloud of bearishness above.
As we’ve touched on in numerous webinars, it’s important for traders to fully utilize the customization features offered by the Swing Trading System. One of its key benefits is its ability to simplify complex charts. After a thorough review, traders have the option to toggle certain studies on or off, reducing potential confusion. Additionally, it’s useful to focus on the most recent pressure trend, like the blue bullish pressure that kicked off yesterday, until that pressure ceases.
If you’re scanning the one-minute chart to pinpoint precise entry points, take advantage of the extreme pressure support and resistance labels. In the example below, the one-minute chart is set to display the strongest level of pressure, with the color changed to blue (to align with the high-pressure state of the 15-minute chart). This helps focus on buying into the uptrend, moving in sync with the bullish pressure direction.


4220 Level

NQ?


While it’s not an ideal entry point because of the current lack of momentum, it’s still worthwhile to take a small position. If a larger downward movement materializes, there’ll be multiple opportunities to sell short during typical price retracements.
What a week. Beautiful.

